


New Quarterback Stats: Self-Sack Score and Sacks Above/Below Expected help pinpoint how much QBs are to blame for their sacks
Let's quantify this age-old question regarding who's to blame for QB sacks

Who really deserves the blame for quarterback sacks in the NFL?
Forever, offensive lines shouldered 100% of the criticism. At least among fans and in the media.
Over the past decade-plus, football analysts have come to realize the quarterback himself has much more to do with his own sack total than previously believed, regardless of the qualify of his blocking unit.
I wanted to answer the question, once and for all. Or at least as specifically and quantifiably as possible. So I set out to create two new sack-related metrics from the 2024 season with the 40 quarterbacks who attempted at least 200 passes.
And I can first tell you this — the NFL average pressure-to-sack rate (how often a pressure turned into a sack) in 2024 was 18.69%, and the league average pressure total (among these qualifying quarterbacks) was 153.
I then used this very simple formula to compute Self-Sack Score (SSS).
QB’s pressure-to-sack rate / league average pressure-to-sack rate = SSS
SSS is anchored at 1.0 — meaning if a quarterback has an SSS of 1.0, he’s right at the league average for pressure-to-sack rate (which, again, was 18.69% in 2024 among qualifying quarterbacks).
Here’s how to interpret SSS:
SSS above 1.0 = QB takes more sacks than expected under pressure → possible self-inflicted sacks
SSS below 1.0 = QB avoids sacks under pressure better than most → good pocket feel or decision-making
Here’s a color-coded bar graph for Self-Sack Score using 2024 regular-season data:
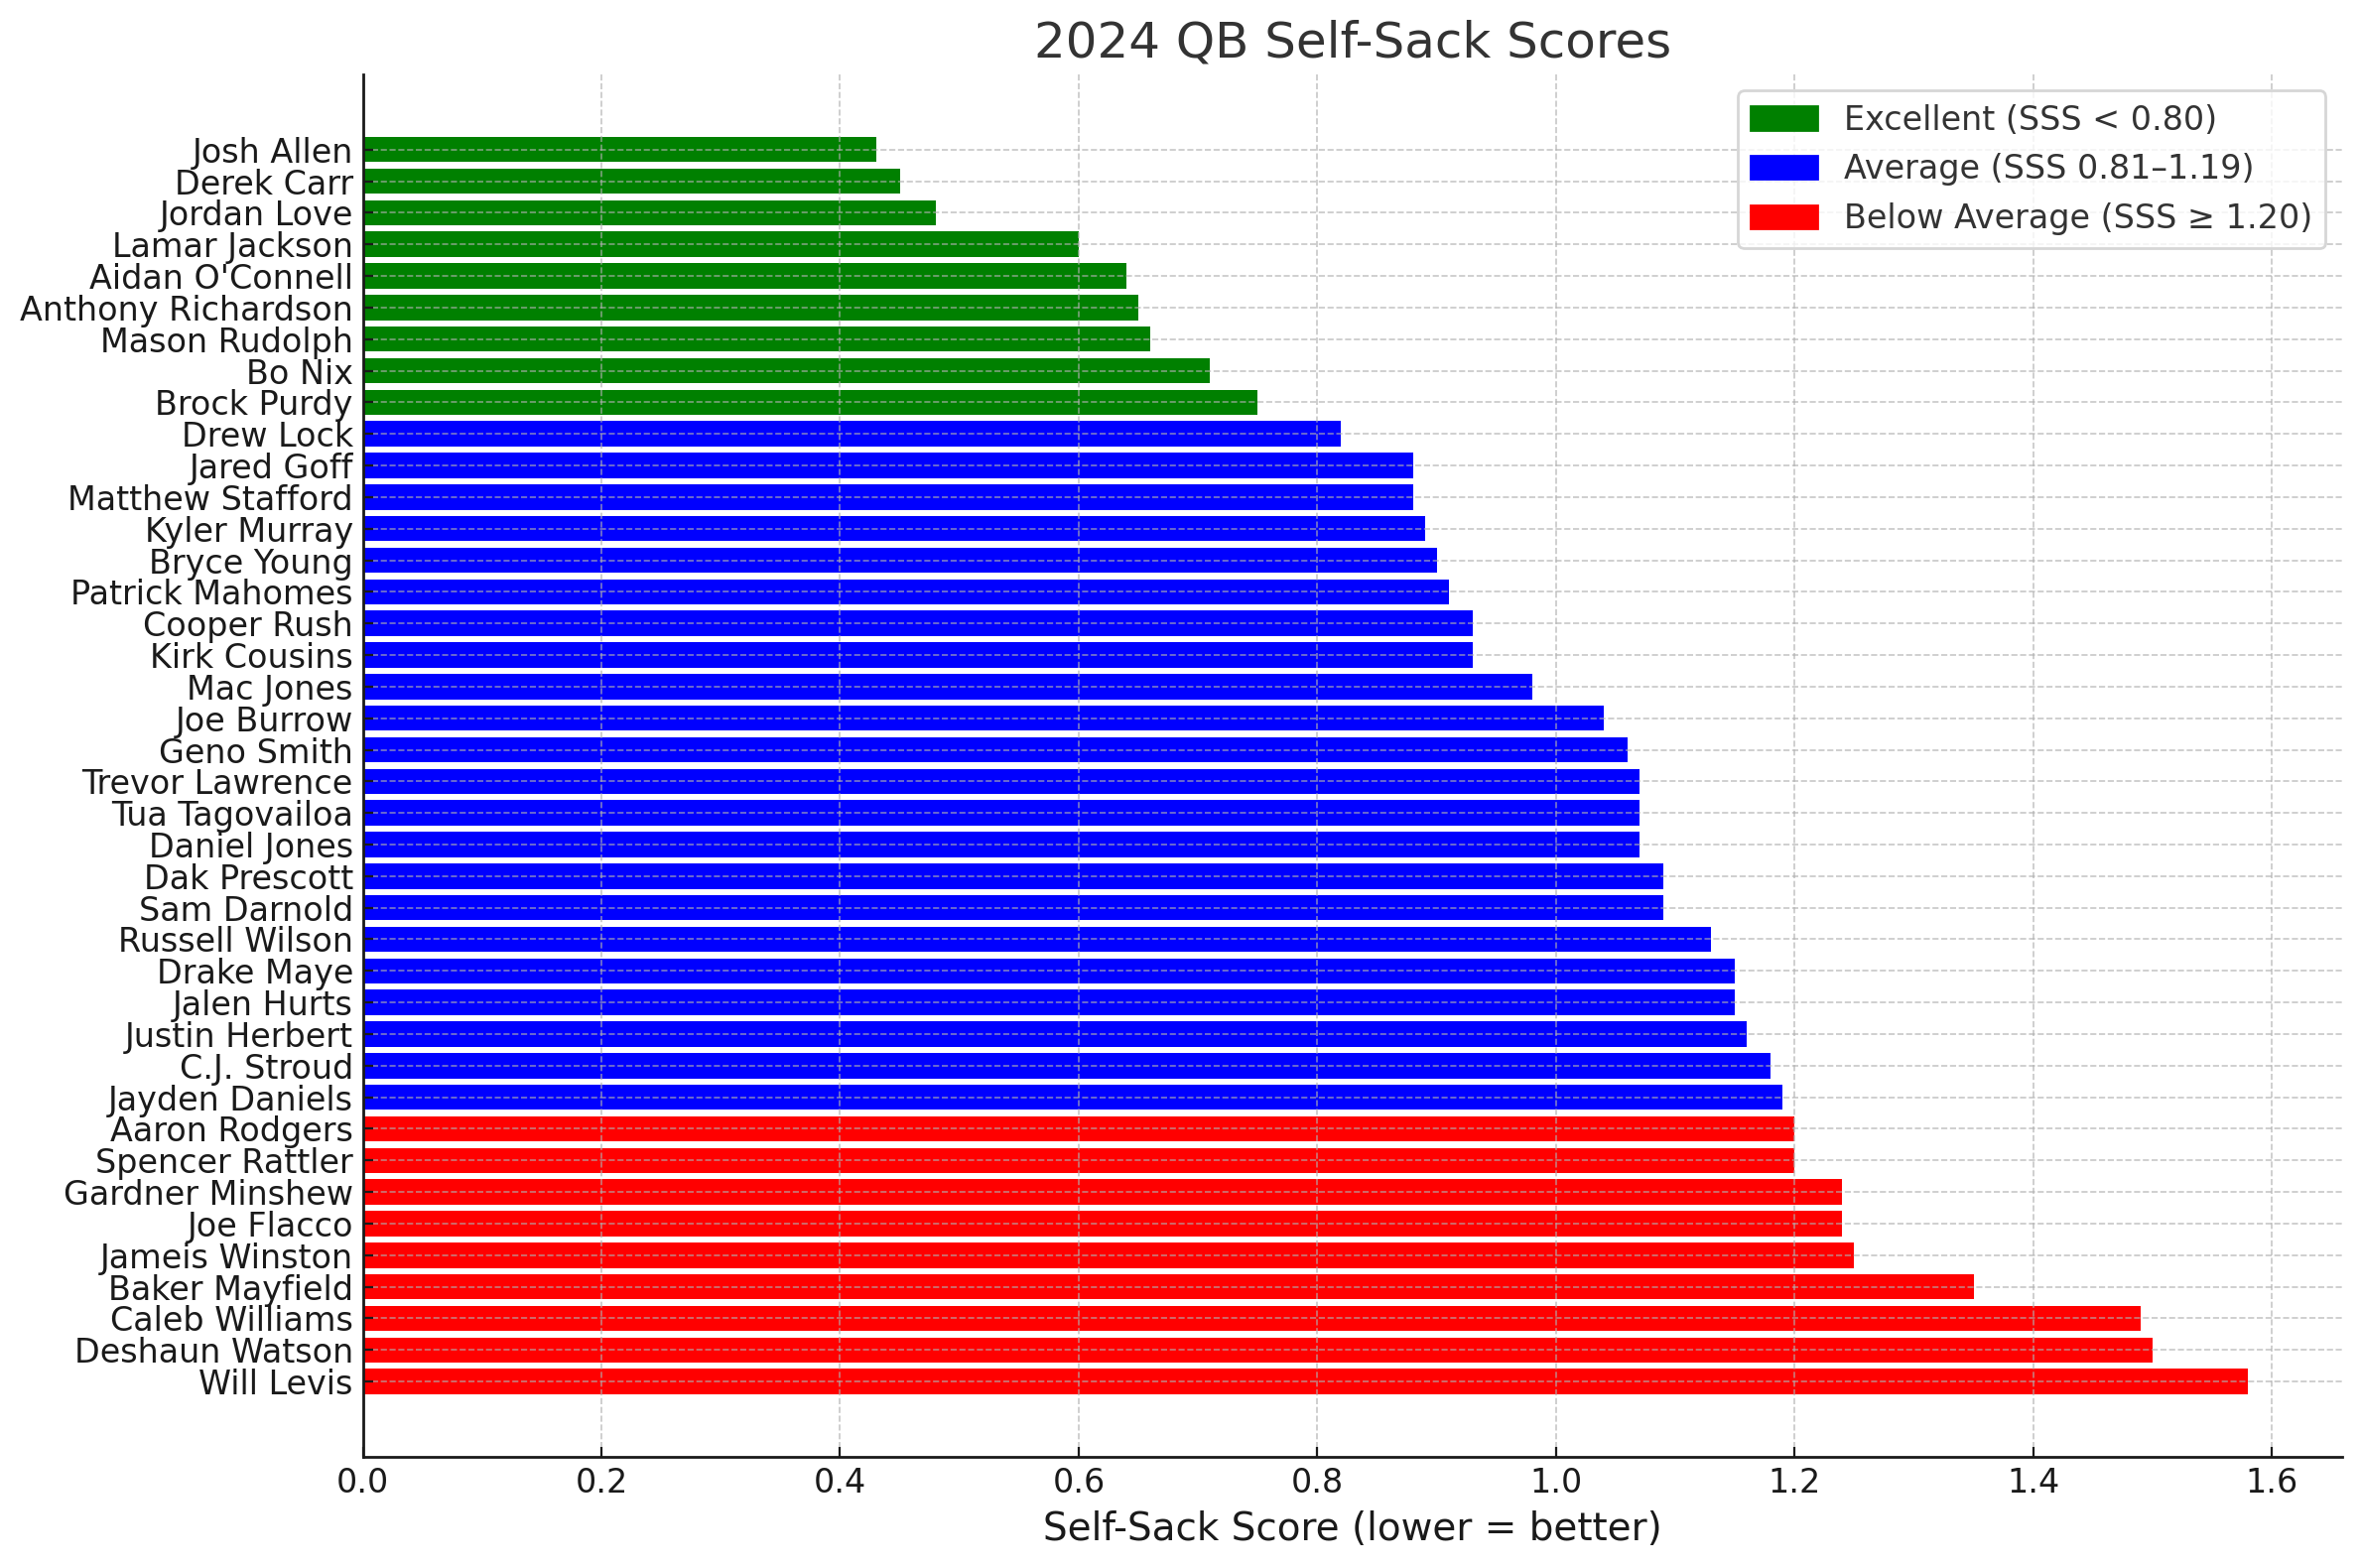
Now, technically, *only* 1.0 is “average.” But I provided some wiggle room with the color-coding for quarterbacks hovering closely on either side of 1.0. Everyone from Mac Jones up to Josh Allen had a pressure-to-sack rate lower than the league average of 18.69%. From Joe Burrow down, the pressure-to-sack rates were higher than NFL average.
SSS is a percentage-based metric. I wanted a volume one too.
Naturally, I generated Sacks Above/Below Expected (SABE) with this super-simple two-step formula.
(And don’t worry, I’ll write an article that serves as an all-encompassing guide for all the new stats I’m creating — with this super-simple two-step formula.)
First, I found “Expected Sacks” which is just a QB’s total pressures multiplied by the league average pressure-to-sack rate.
Then, I calculated Sacks Above/Below Expected with this elementary formula:
QB’s actual sacks - Expected Sacks = SABE
Before I show the Sacks Above/Below Expected graph from 2024, I must write — it isn’t perfect. Obviously. No metric is.
It doesn’t specifically account for offensive line quality
It doesn’t isolate “time to throw”
It doesn’t factor in play design
It treats all pressures the same
Here’s Sacks Above/Below Expected from the 2024 season:
Please note: This is a stat in which a negative number is better. It indicates a quarterback “below” his expected sack total.

The average SABE in 2024 was +0.26 sacks. Or, in plain English, the average QB’s sack total was about a quarter sack higher than “expected” given his pressure load.
Josh Allen led all qualifying quarterbacks with a SABE of -18.9. Given how many times he was pressured, he was expected to be sacked 19 more times. And he was only sacked 14 times through the entire regular season.
Jordan Love (-15.3) and Lamar Jackson (-15.1) came in second and third, respectively, and rookie Bo Nix did a marvelous job avoiding sacks with a -9.3 SABE.
Ironically, Jaguars teammates Mac Jones (-0.2) and Trevor Lawrence (+1.2) were the closest to the league average of +0.26.
There were 18 quarterbacks with sacks below expected and 22 quarterbacks with sacks above expected. Deshaun Watson (+10.9), Will Levis (+14.8), and Caleb Williams (+23) with the three worst SABEs isn’t surprising.
Jayden Daniels with the sixth-worst SABE (+7.4) was. The same goes for Jalen Hurts with the 10th-highest SABE at +4.9.
So there you have it, TrapSheet readers. Two new metrics — both of which I’ll be tracking/updating during the 2025 NFL season for your perusal — that bring us closer to pinpointing just how much each quarterback contributes to his own sack total.
One thing I’d love to understand better (and it’s not currently measured to my knowledge) is how the scheme and pass pro calls play a factor. Separate the “did we call the right protection to prevent this pressure/sack?” part of pressure/sack analysis from “are the 5 (or more) guys blocking for me good at it?” and “how is my QB’s play factoring into this?”
Take Burrow for example. Is he slightly above average for responsibility because it’s something he does? He’s often praised for his escapability and slipperiness in the pocket while his OL takes the blame, but the data you’ve shown (and I’ve noticed elsewhere — Steven Patton of FTN) point to him being just an average QB. I feel like he may be held back by a shotgun-heavy, pass-first scheme that allows defenses to stay in a “hunt the QB” mode all game and dial up more creative pressures. Compare that to Allen/Jackson… both guys have balanced offensive attacks that keep defenses honest.
Along those same lines, I’d be curious to see how those numbers evolved for Allen from Brady compared to Dorsey/Daboll offenses which had Allen under center way less and were pass-heavy.
Cool. I wonder if there’s a way you could use something like PFF team pass blocking grades to help filter out offensive line play/quality from this. I’ll be following along with you this season.